In this exercise, you will use the Wage dataset to calculate normal distribution probabilities with the pnorm function. Access the help file for the dataset using ?Wage to see the codebook.
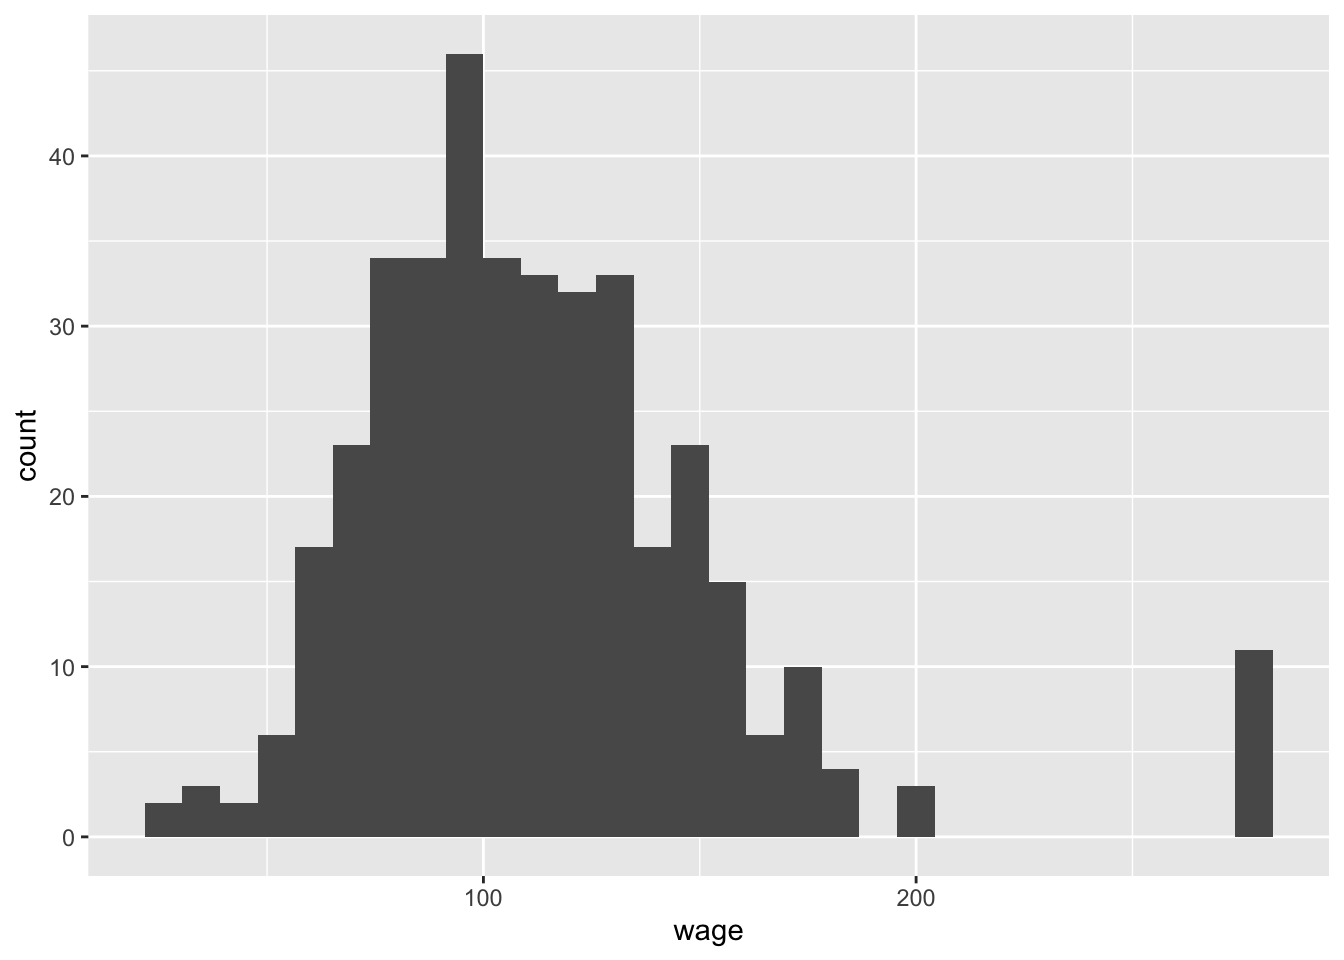
Generate a histogram of the workers’ raw wages in 2008. Based on the histogram of this sample of wages, do you think the true distribution of 2008 wages is approximately normal? (Note that this can be justified either way, but you need to explain your reasoning for your choice)
Justification for: Yes, the distribution appears to be approximately normal. The histogram is unimodal and approximately symmetric, though there are outliers.
Justification against: No, the distribution does not appear to be normal because there are outliers on the right tail.
Calculate the sample mean of raw wages in 2008. Assume that the true distribution of wages in 2008 is normal with mean 100 and standard deviation 38. What is the probability that a worker selected at random has a wage greater than or equal to this sample mean?
Wage.2008|>summarise(mean(wage))
  mean(wage)
1    113.552
1-pnorm(113.552,100,38)
[1] 0.3606838
Continue to assume that the true distribution of wages in 2008 is normal with mean 100 and standard deviation 38. Calculate the following quantities:
95% of the workers in the population have a wage above what value?
The middle 50% of workers in the population have wages between which two values?
What is the probability that a worker selected at random from this population has a wage above 250 OR below 50?
qnorm(0.05,100,38)
[1] 37.49556
qnorm(0.25,100,38)
[1] 74.36939
qnorm(0.75,100,38)
[1] 125.6306
pnorm(50,100,38)+(1-pnorm(250,100,38))
[1] 0.09416186
Let’s assume that the conditions hold for the central limit theorem to apply, and assume the population distribution above (normal with \(\mu\) = 100 and \(\sigma\) = 38). Write the distribution of \(\bar{X}\), the sample mean of raw wages in 2008, in mathematical notation by replacing each “*”: \(\bar{X} \sim N(100,38/\sqrt{388})\)
Calculate the following quantities:
the probability that the sample mean of a random sample of size 388 is less than 90
the probability that the sample mean of a random sample of size 388 is greater than 200
the values that designate the middle 95% of the distribution of the sample mean for a sample of size 388
stdev <-38/sqrt(388)pnorm(90,100,stdev)
[1] 1.088163e-07
1-pnorm(200,100,stdev)
[1] 0
qnorm(0.025,100,stdev)
[1] 96.21892
qnorm(0.975,100,stdev)
[1] 103.7811
Now say that we are able to collect another sample that has information on twice as many workers as the 2008 sample size in this dataset. How would the values calculated in the third bullet above (in exercise 5) change? You don’t need to calculate the values; simply state if the probabilities would be larger or smaller and if the values for the middle 95% of the distribution would be closer to the mean or further from the mean.
Doubling the sample size would make the standard deviation of the distribution of the sample mean smaller. This would concentrate the density closer to the mean, so the first probability will be smaller, the second probability will be smaller, and the values for the middle 95% of the distribution will move closer to the mean.
If you know that the true distribution of 2008 wages is right skewed instead of normally distributed, does the central limit theorem still apply? Why or why not?
Yes because the population distribution doesn’t matter if the sample is large enough.