Inference I
What is hypothesis testing?
Hypothesis testing is the procedure that assesses the evidence from the data in favor of or against some claims (hypotheses) about the population.
We will use information from the sample (data) to draw conclusions about the population
What is hypothesis testing?
Usually we have two hypotheses to test:
Null (\(H_0\)): Formally, the null hypothesis makes a claim or assumption about a population parameter. Conceptually, it’s the “nothing special is going on” hypothesis.
Alternative (\(H_A\)): A statement that is contradictory to the null hypothesis. Conceptually, it is the “something special is going on” or “the variables are associated” hypothesis.
Poll
As we test the hypotheses, do you think it would be better scientific practice to operate under the assumption that the null hypothesis is true (i.e., nothing special is going on) or that the alternative hypothesis is true (something special is going on/the variables are related)?
For example, imagine you work for the FDA and you are assessing whether or not a new drug should be approved. Do you think it is better practice to 1) assume that the drug is not effective until the data prove otherwise, or 2) assume that the drug is effective until the data prove otherwise?
Hypothesis testing framework
- Start with two hypotheses about the population: \(H_0\) (null) and \(H_A\) (alternative).
- Choose a representative sample.
- Assess how likely the sample data can be observed given that the \(H_0\) is true.
- If the data are very unlikely to be observed when \(H_0\) is true, then we reject \(H_0\); otherwise, we cannot reject the null hypothesis.
P-value
The probability of observing the data or even more extreme values assuming that \(H_0\) is true.
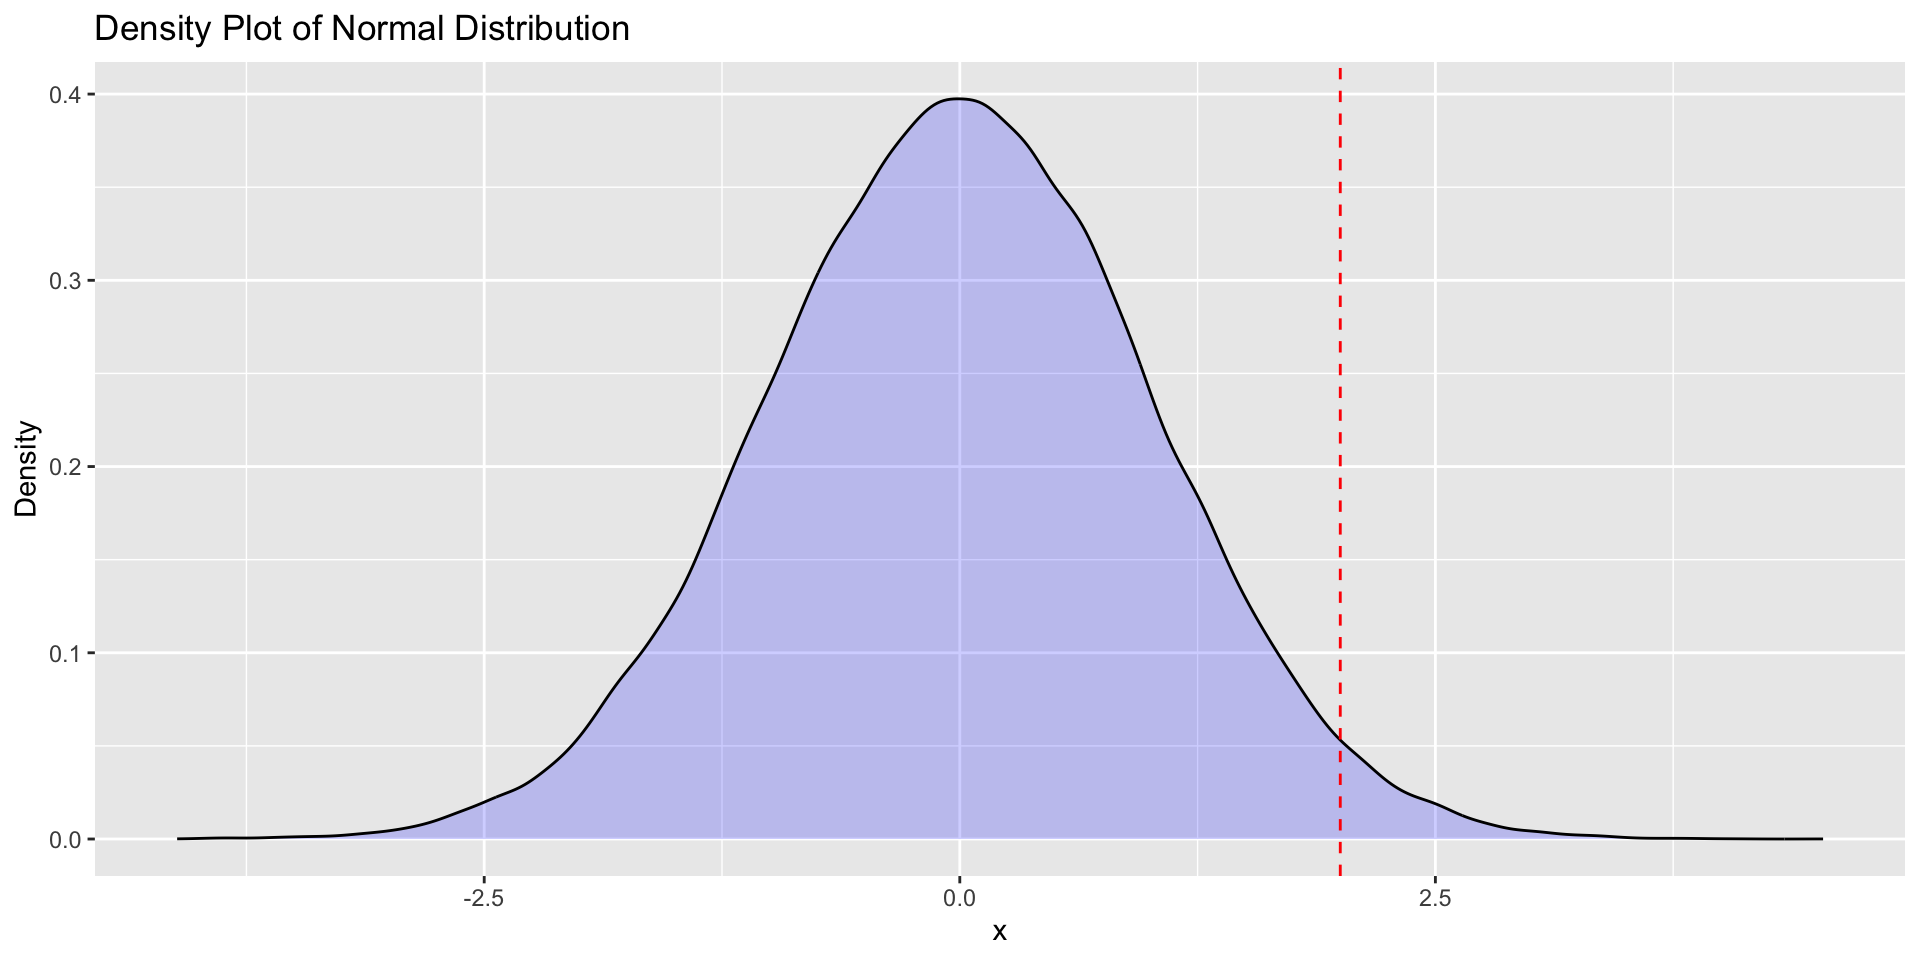
- \(H_0:\mu=0;H_A:\mu>0\).
- Then p-value \(=P(X>x_{obs})\) when \(\mu=0\)
- It is NOT the probability of \(H_0\) is true
- What if \(H_A: \mu \neq 0\) ?
P-value
Which region of the plot below constitutes the p-value?
Significance level
A predetermined threshold used to tell whether a result is statistically significant; usually denoted by \(\alpha\) and set as 0.05.
- If the p-value is smaller than \(\alpha=0.05\), then we can reject \(H_0\) at 0.05-significant level.
- If the p-value is greater than \(\alpha=0.05\), then we fail to reject \(H_0\) at 0.05-significant level.
Note: We can NEVER say we accept the null hypothesis, even if the p-value is greater than the significance level.
Simulation-based Inference vs. Parametric Inference
Simulation-based inference
Simulate the null distribution with resampling methods
Very flexible, but requires computation power
Parametric Inference
Make assumptions about the probability distribution of our population
Relies on statistical theory such as central limit theorem
Why learn both approaches?
Simulation-based inference can be intuitive, and is more flexible
Parametric inference has been around for a long time and you will likely see it more in practice